The Experiment Viewer is one of the two main windows of ETHermodynamics.
Once an experiment is set up in the Experiment Builder, it can be run. The Experiment Viewer will display the experiment system and data calculated from the simulation.
You can change what data is displayed on the left and which graphs are displayed on the right.
The experiment viewer allows you to perform various exports: For example, you can export a picture of either the experiment or graphs, a movie of the experiment, or a table of all data collected in the experiment.
Overview
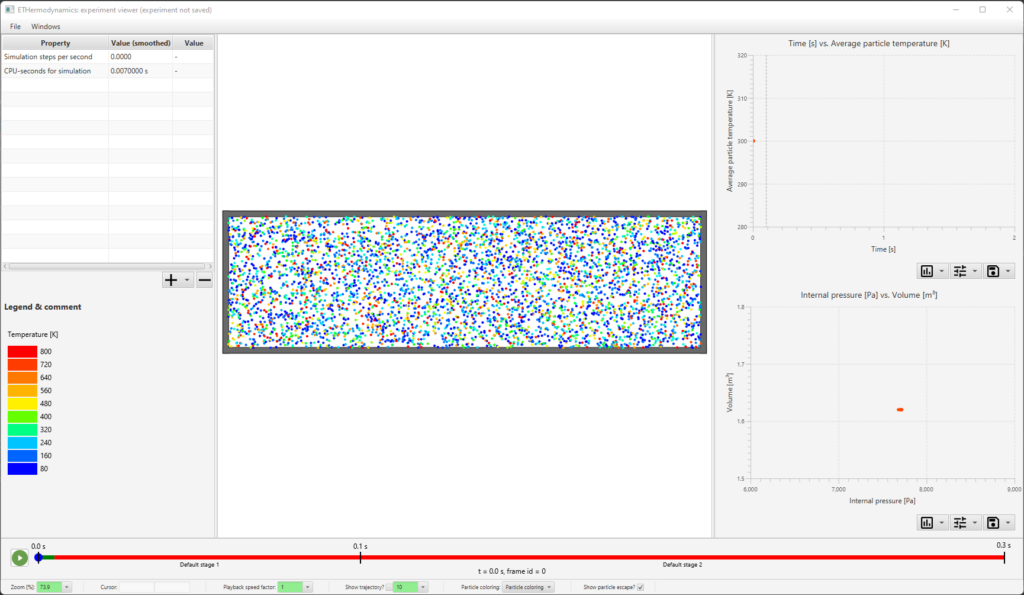
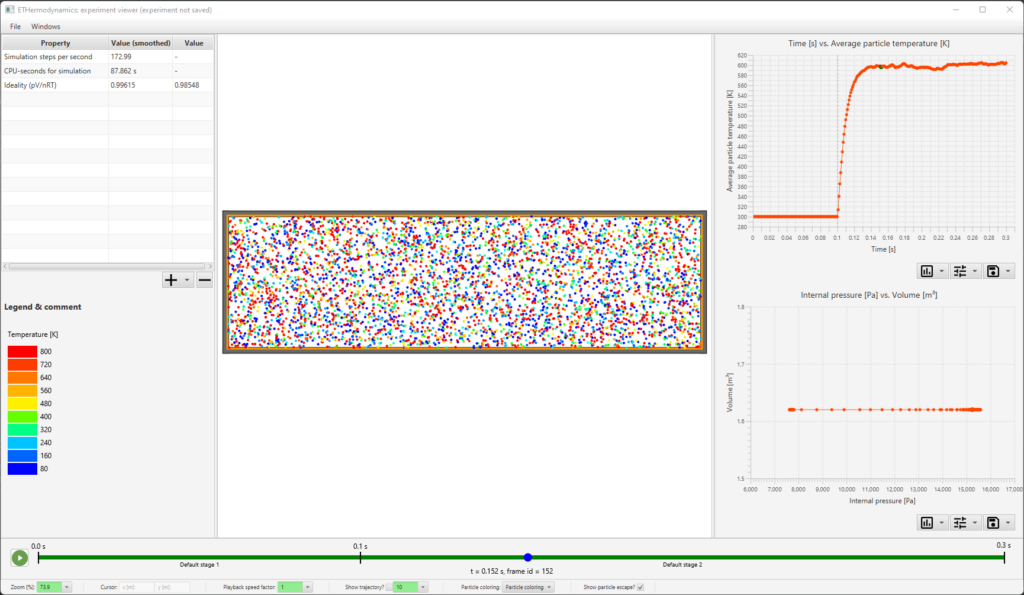
The experiment viewer is where your ETHermodynamics experiments are simulated and information about them is displayed. It has a similar 5-part structure to the experiment builder. Similar to the experiment builder, the experiment viewer is layed out in 5 regions:
top: a menu bar.
left: a table to display properties for the current frame of the experiment, as well as a legend.
center: a view of the current frame of the system.
right: two graphs displaying data for the experiment.
bottom: a timeline of the experiment that indicates the stages, as well as how much of the experiment has been simulated.
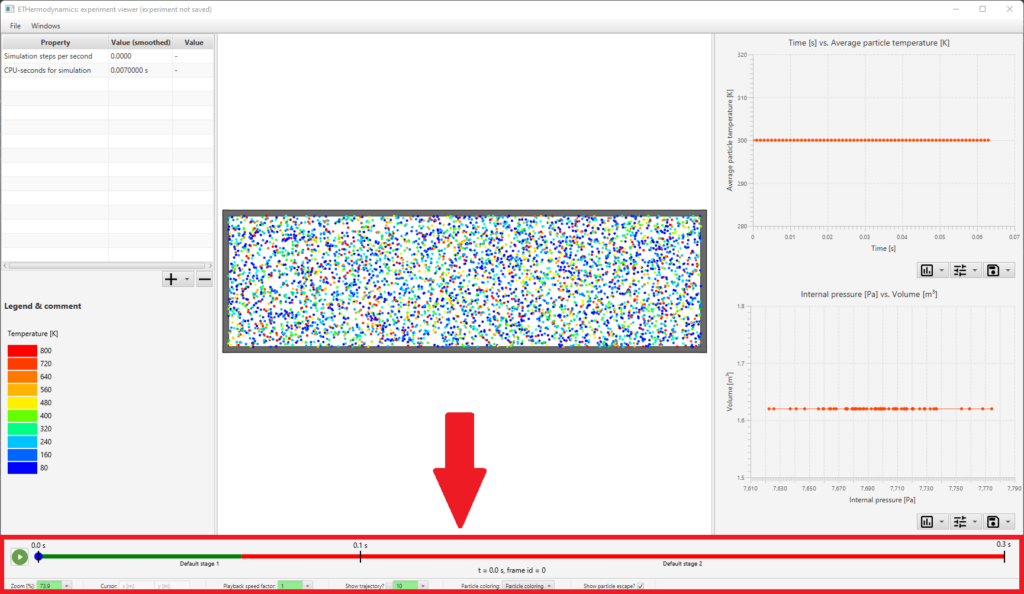
Timeline
At the bottom of the screen is the timeline. The part of the bar that is colored green denotes the fraction of the experiment that has already been simulated. You can play a movie of the simulated experiment, or navigate to a frame.After a moment, the entire experiment is simulated: you can see the entire timeline at the bottom has turned green. You can navigate on the timeline similar to how you would in other video-displaying software. Try to navigate to a point in the second stage by clicking on the timebar.
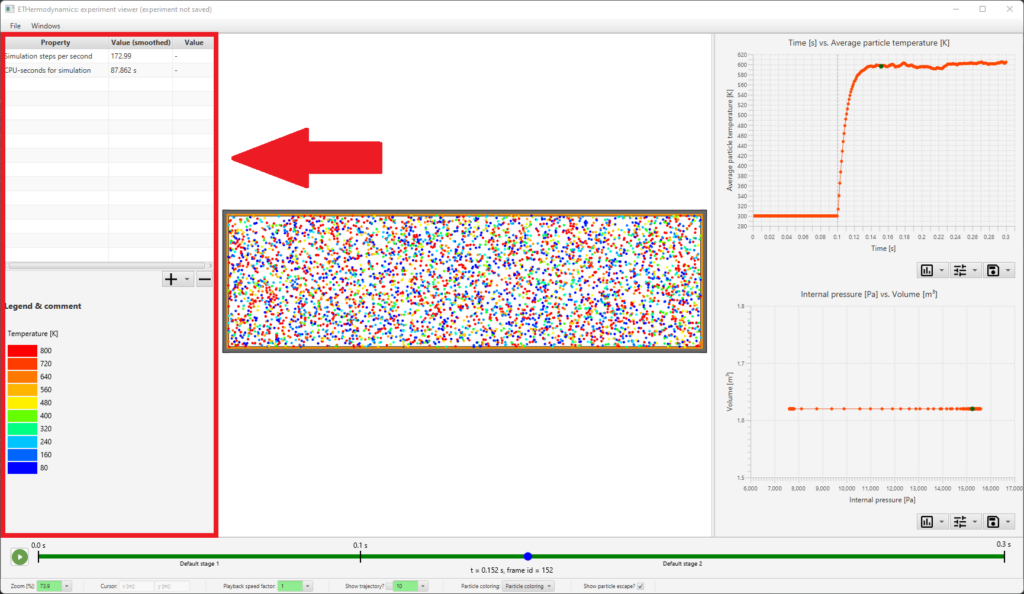
Property display
On the left you can see a legend and a table. The table displays properties of the current frame of the experiment.Try adding a new property to the properties-table: Click the “+” below the table and select > Chamber > Ideal gas: Ideality (pV/nRT). A new property is added to the table that tells you how close to ideal the gas in the chamber behaves.
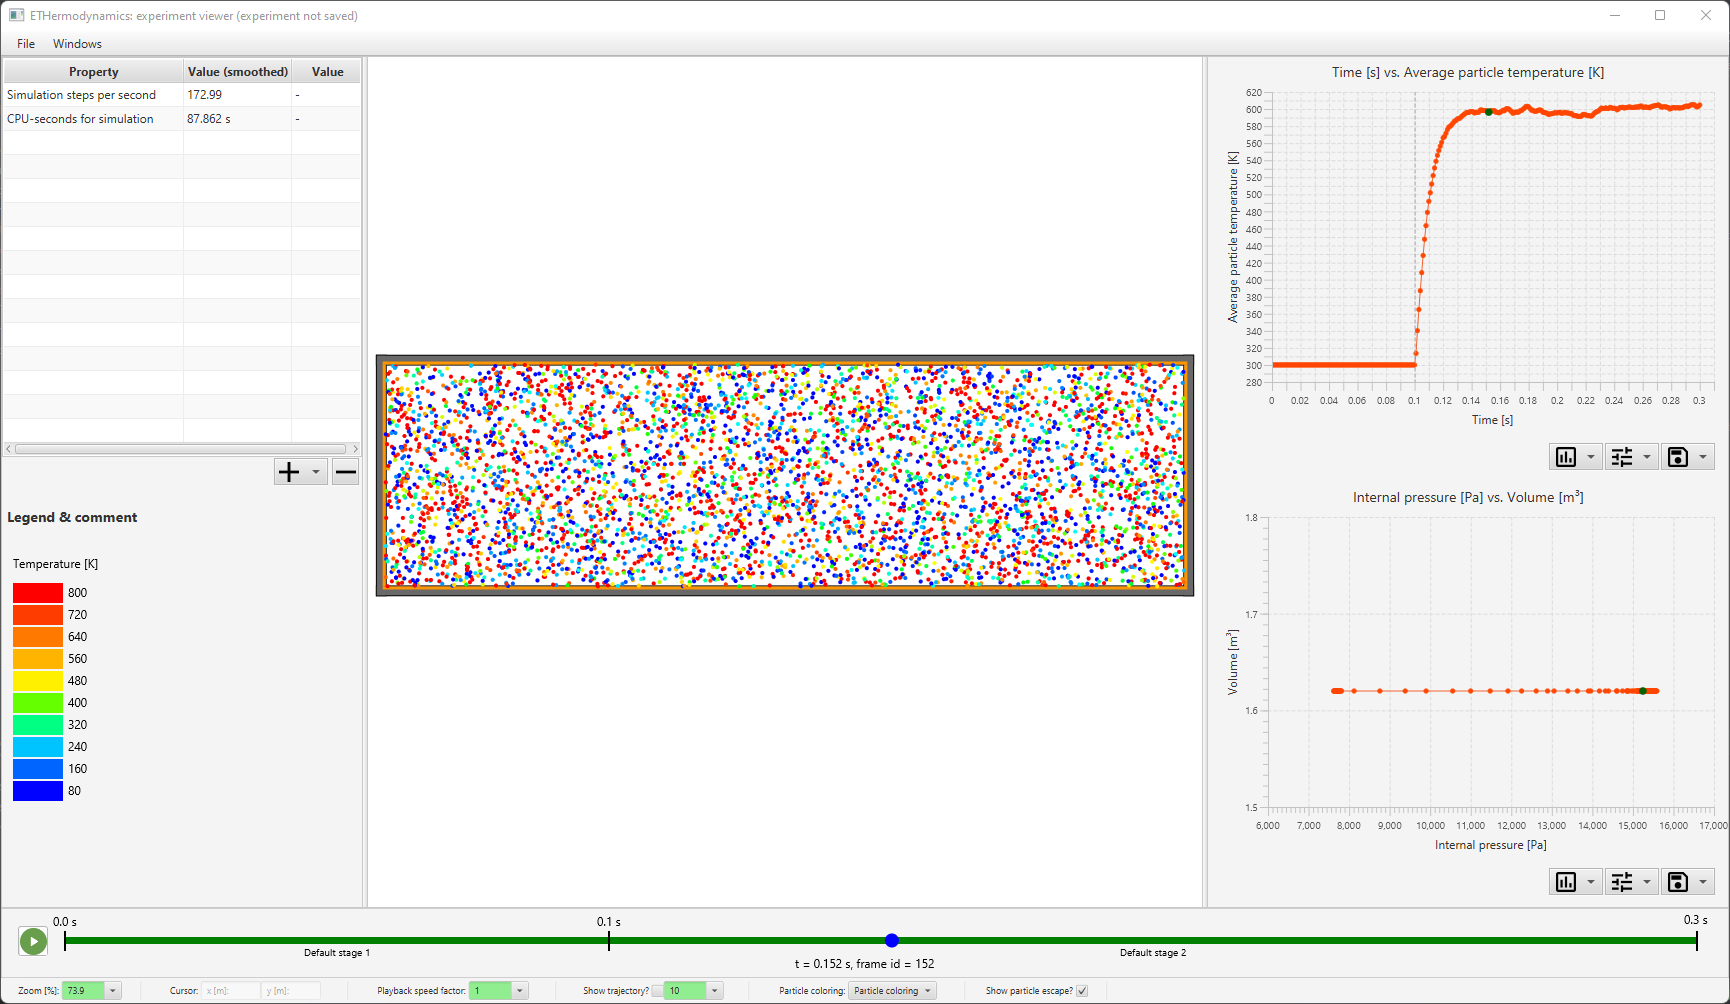
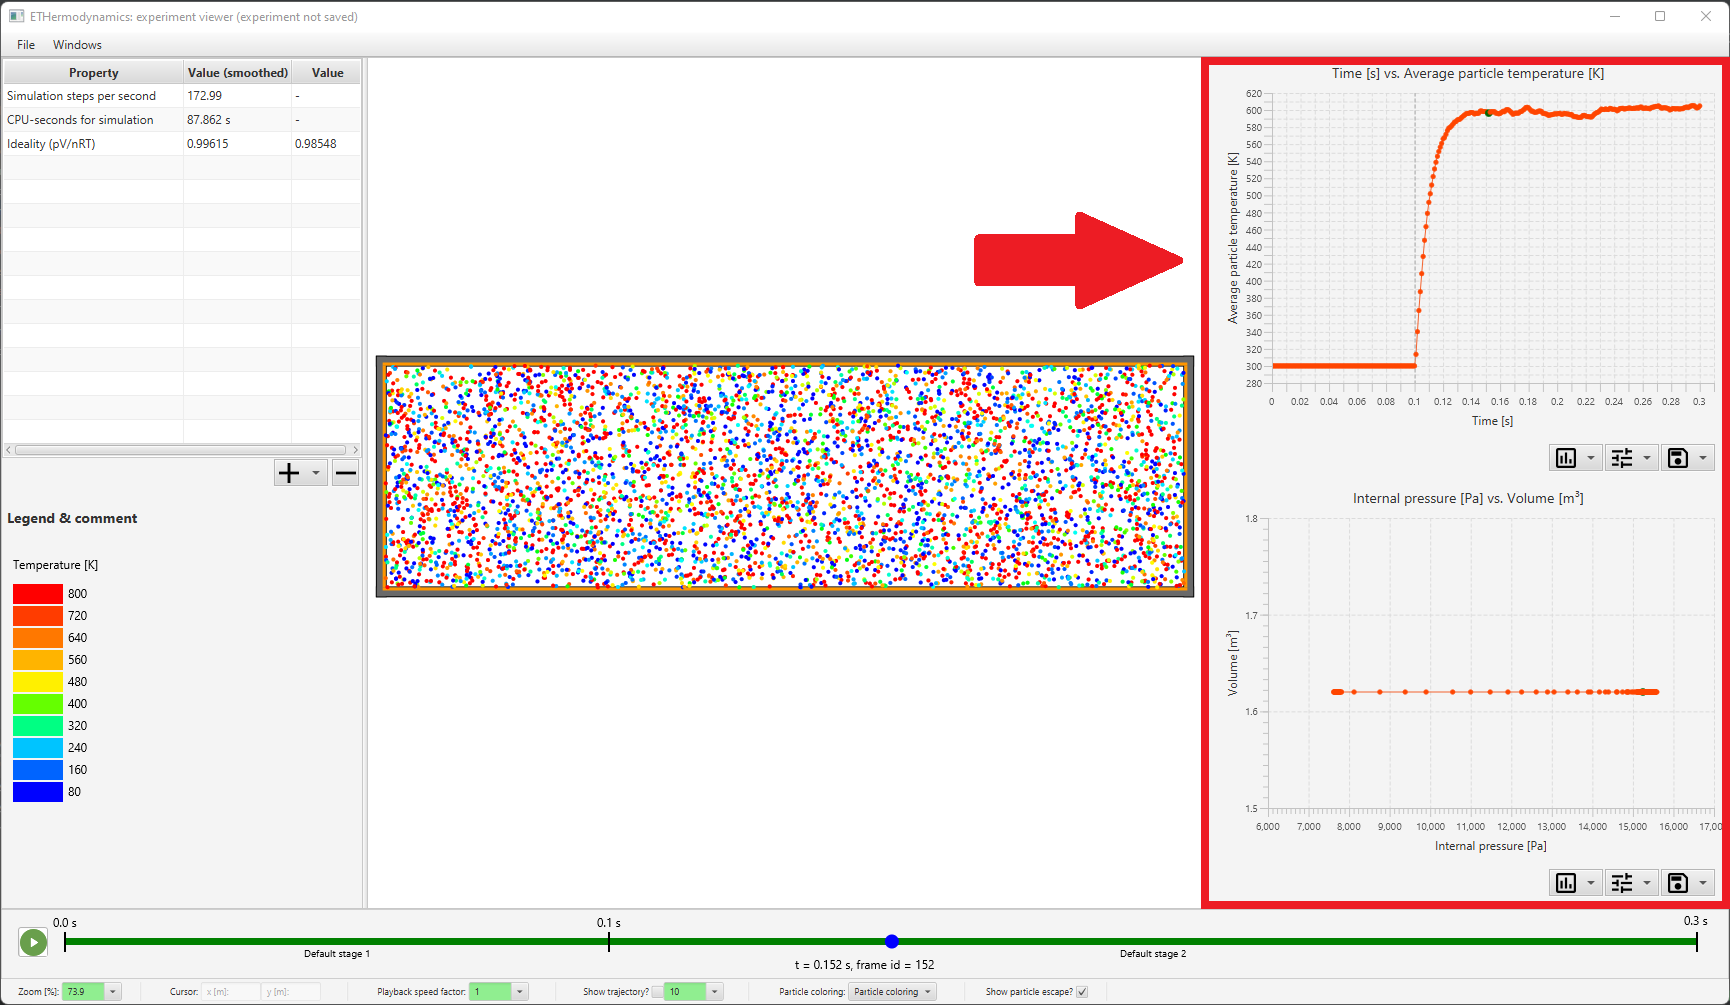
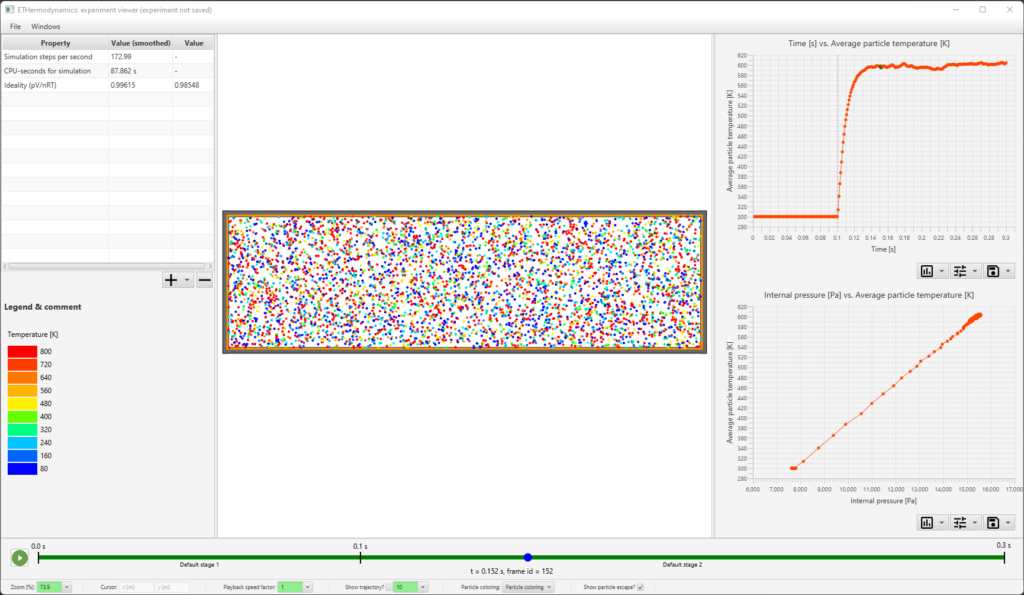
Graphs
On the right you can see two graphs displayed. They update automatically as more data is collected during simulation.You can change the grahs that are being displayed. Navigate to the middle button below the bottom graph and select > x-axis property > Chamber > Ideal Gas: Particle Temperature.
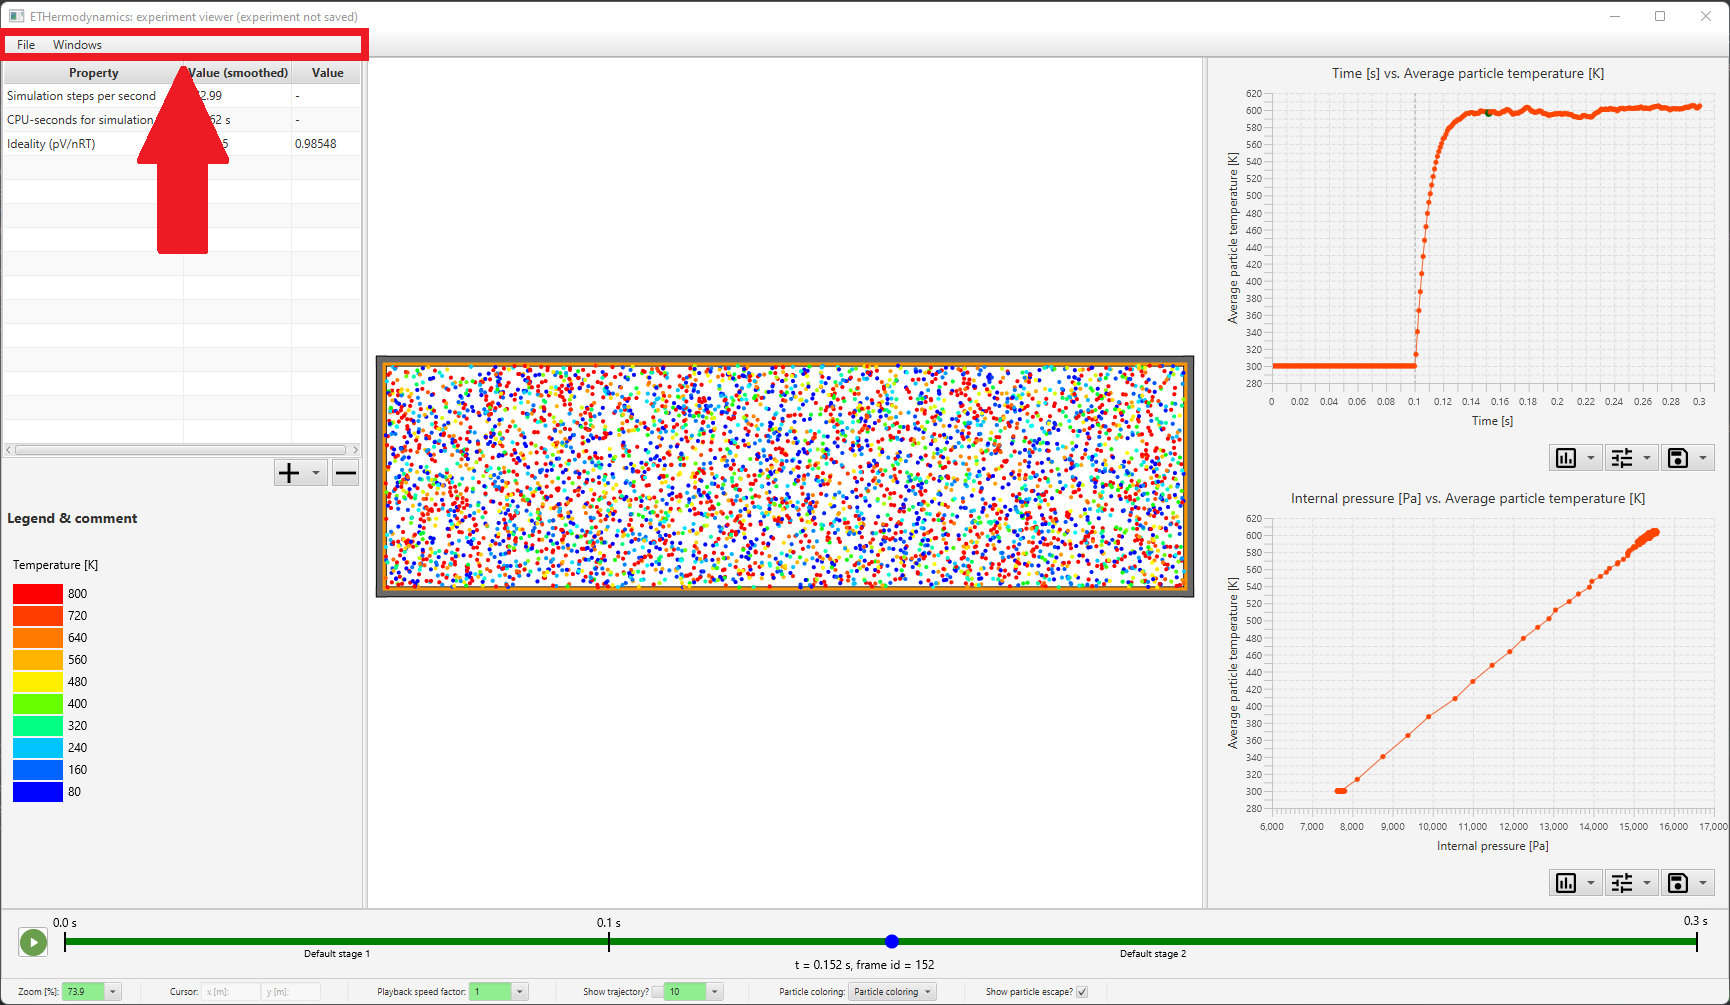
Menu options
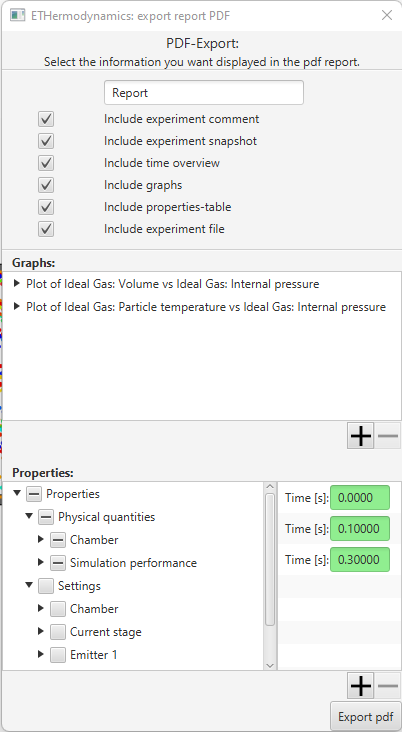
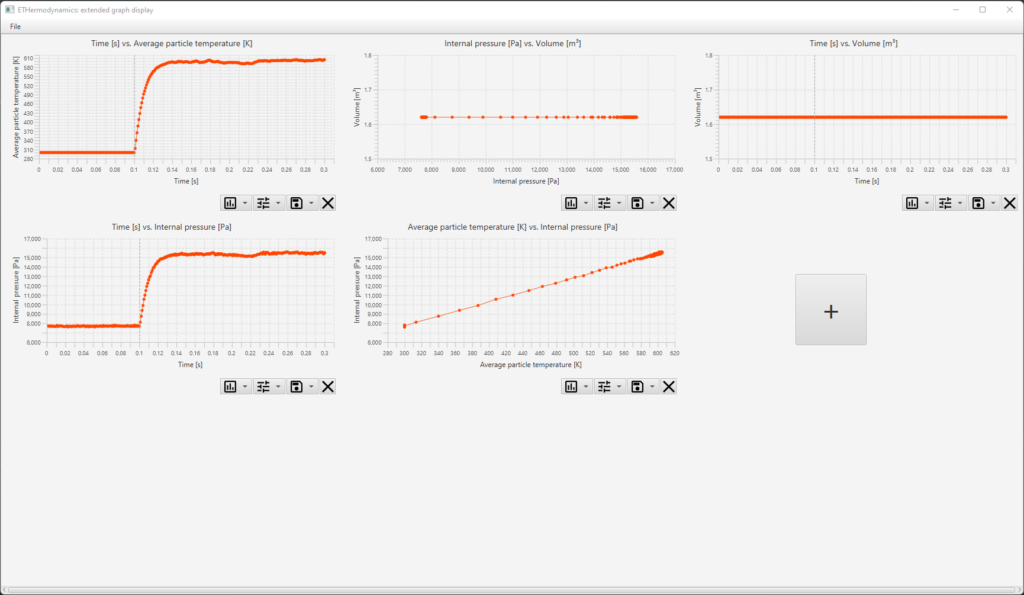
On the top left there is a menu. It contains various useful options, such as exporting data or setting the current property- and graph-display to be the default for future experiments.One thing you can do in the menu is export a report. A report is an extensive pdf containing various information about your experiment, such as a picture of the setup, different graphs, a property-table, etc.You can also open a new window that allows you to display many more graphs than just the two that you can display in the experiment viewer main window. There are many more things you can do from the menu: just try them out!